Welcome
Welcome to TurfMind, where football analytics meets coaching insights. Explore the beautiful game like never before as we merge cutting-edge data analytics with the art of coaching. Whether you're a football enthusiast looking to dive deeper into the numbers behind the game, an aspiring coach seeking valuable insights, or a seasoned pro searching for innovative strategies. Access the power of data-driven decision-making, discover hidden trends, and elevate your football knowledge.
Our Aim
Our aim at TurfMind is to merge football analytics and coaching expertise, making them accessible to everyone. We believe that the synergy between data-driven insights and coaching wisdom can transform the way football is understood, taught, and played. Our platform is designed to empower football enthusiasts, coaches, and players alike, offering a comprehensive range of features, from in-depth player statistics to tactical perspectives and educational content. We aim to bridge the gap between raw football data and actionable coaching insights, fostering a deeper appreciation of the game's intricacies.
League Comparison
At TurfMind, we have analysed Europe’s top 5 leagues; English Premier League, La Liga, Bundesliga, Serie A, and Ligue 1. For each league, we present data from 2014 until 2023. We will be relying on annual historical data to offer deep examination on the overall trends in the game for every year.

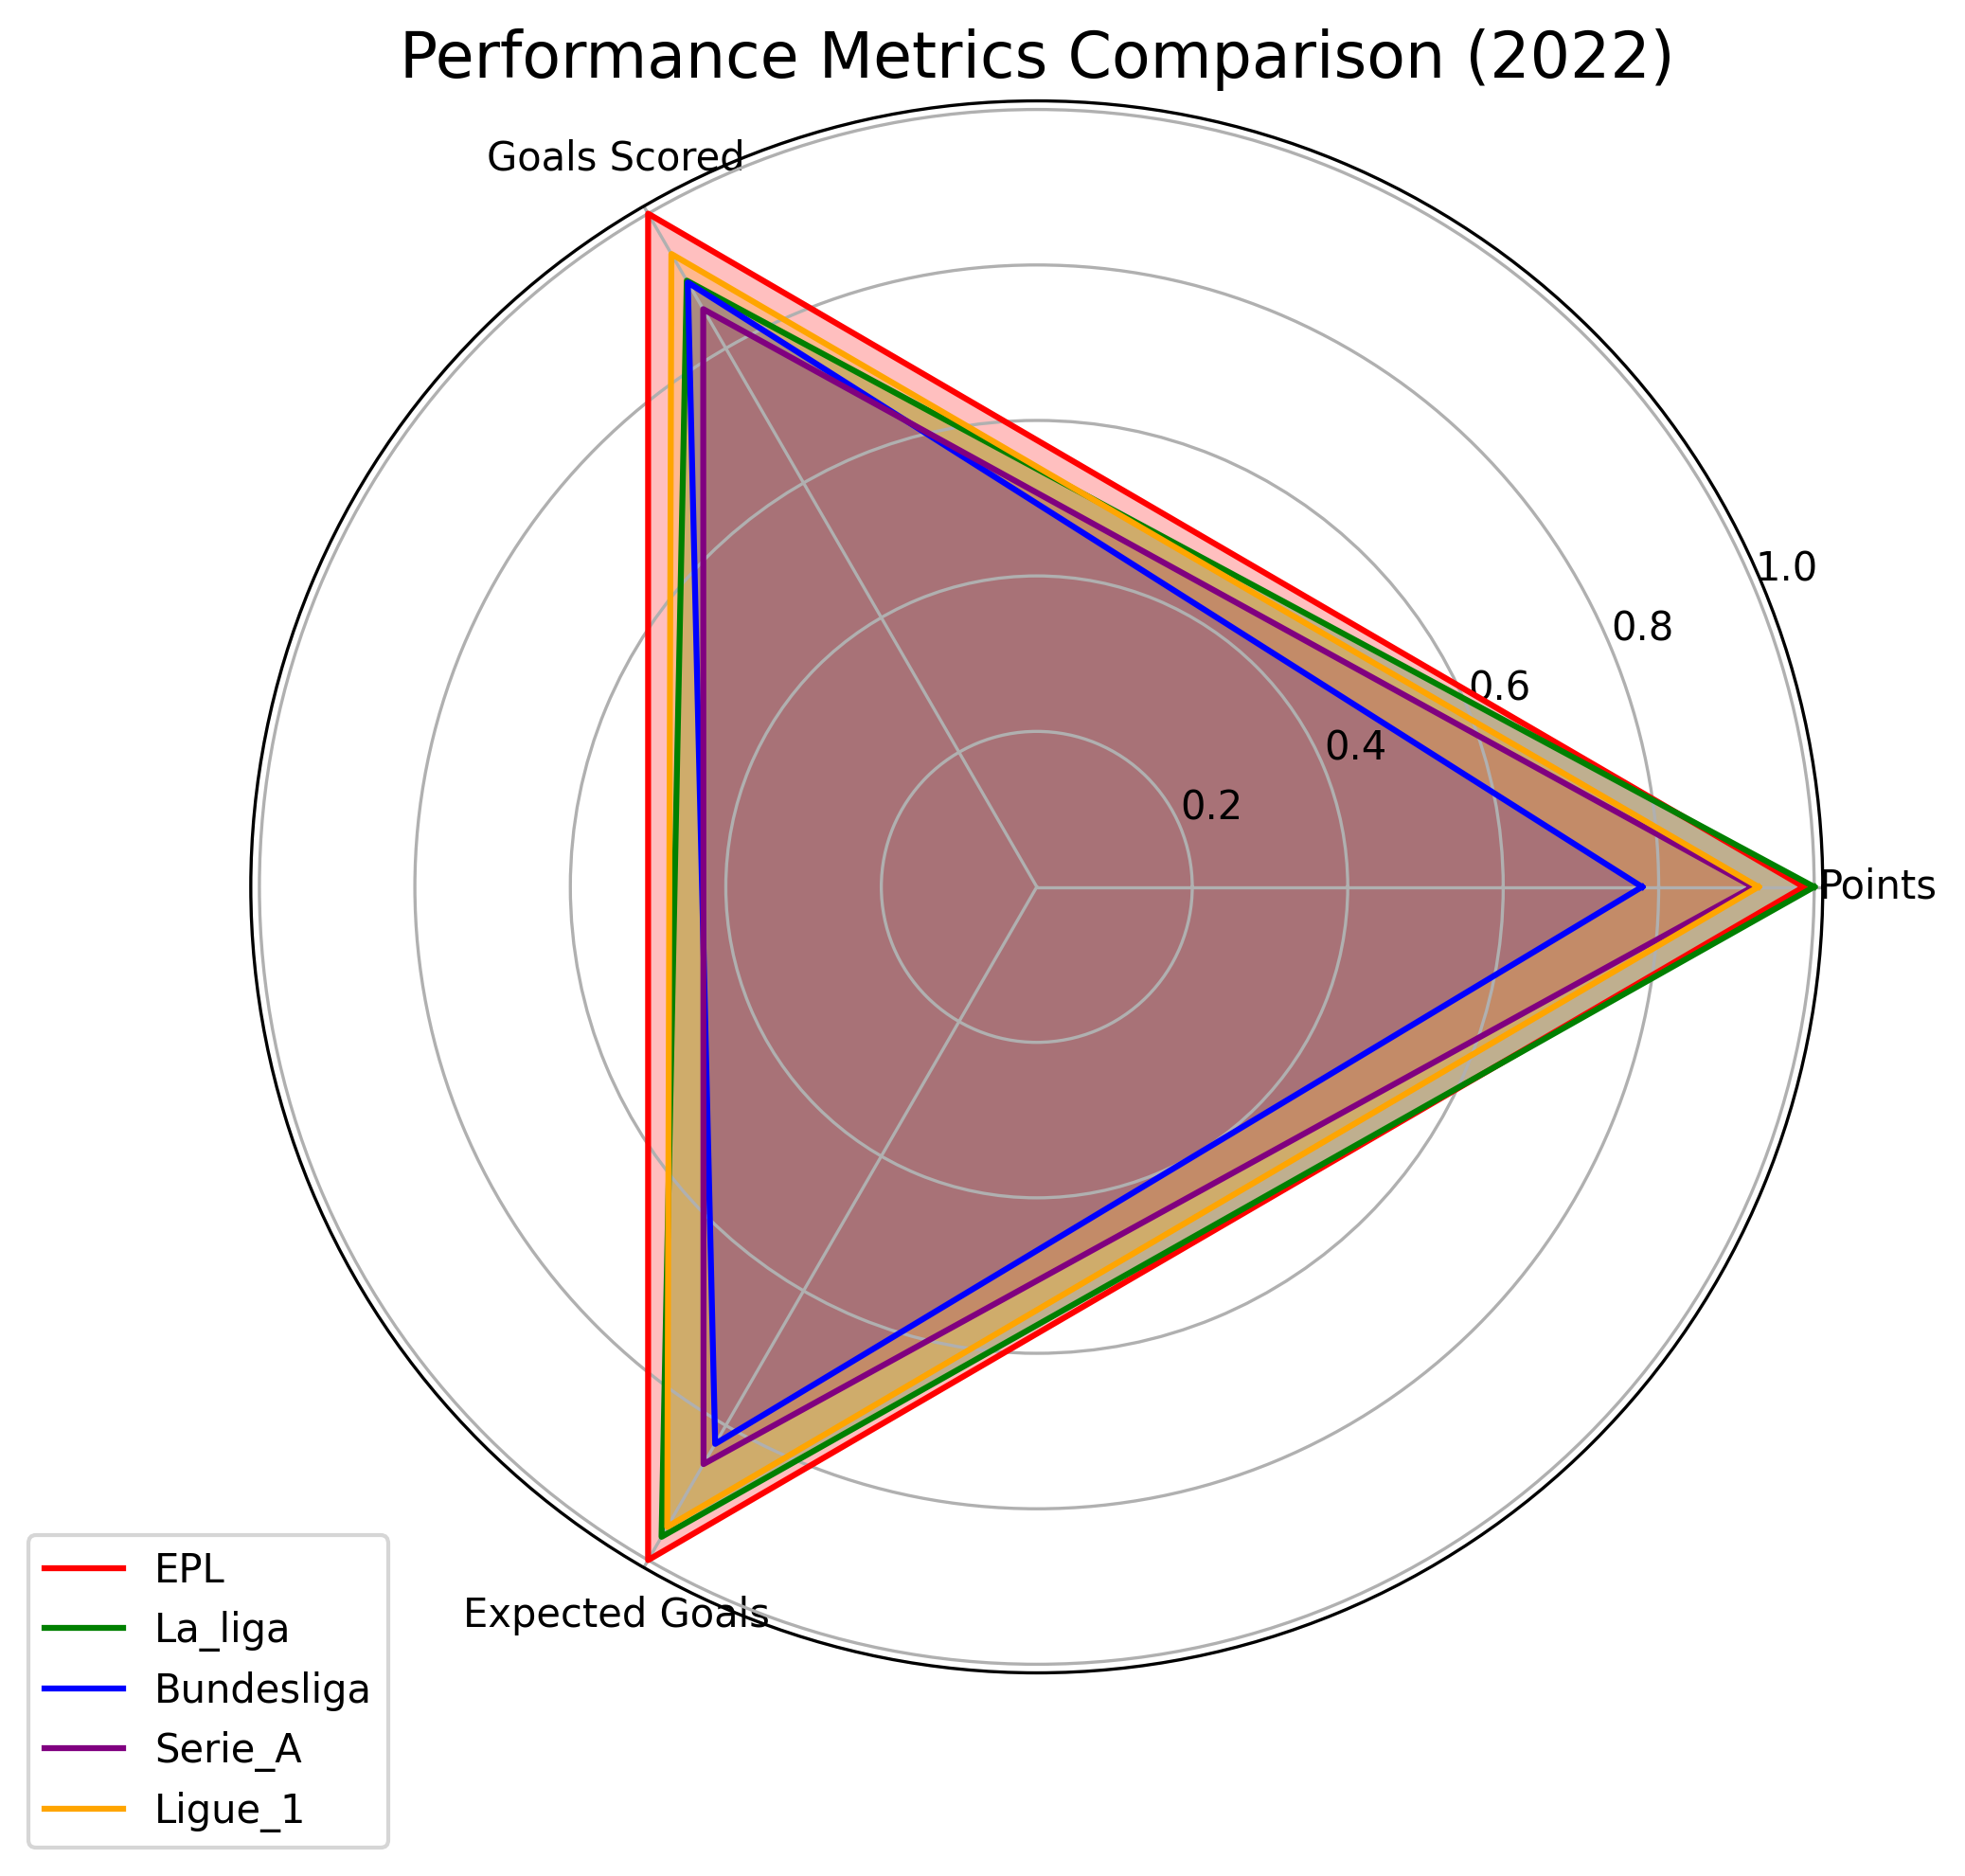
The radar chart above illustrates a comparative analysis of performance metrics for Europe's top five football leagues in the 2022-2023 season.
From the data, we observe that EPL leads in the category of 'Goals Scored', indicating a highly offensive playstyle. Also, EPL shows a greater number of 'Expected Goals', suggesting they create the most scoring opportunities. In terms of 'Points' accumulated, EPL again is in the lead, potentially due to their consistent match-winning performances.
This visual representation aids in the easy comparison of the leagues across multiple facets of gameplay, showcasing their unique characteristics and providing a comprehensive overview of their performance. The overlaid triangles reveal how closely matched the leagues are, with areas of overlap indicating similar levels of performance in specific metrics. Such data is invaluable for deeper strategic analysis and fostering competitive improvement.


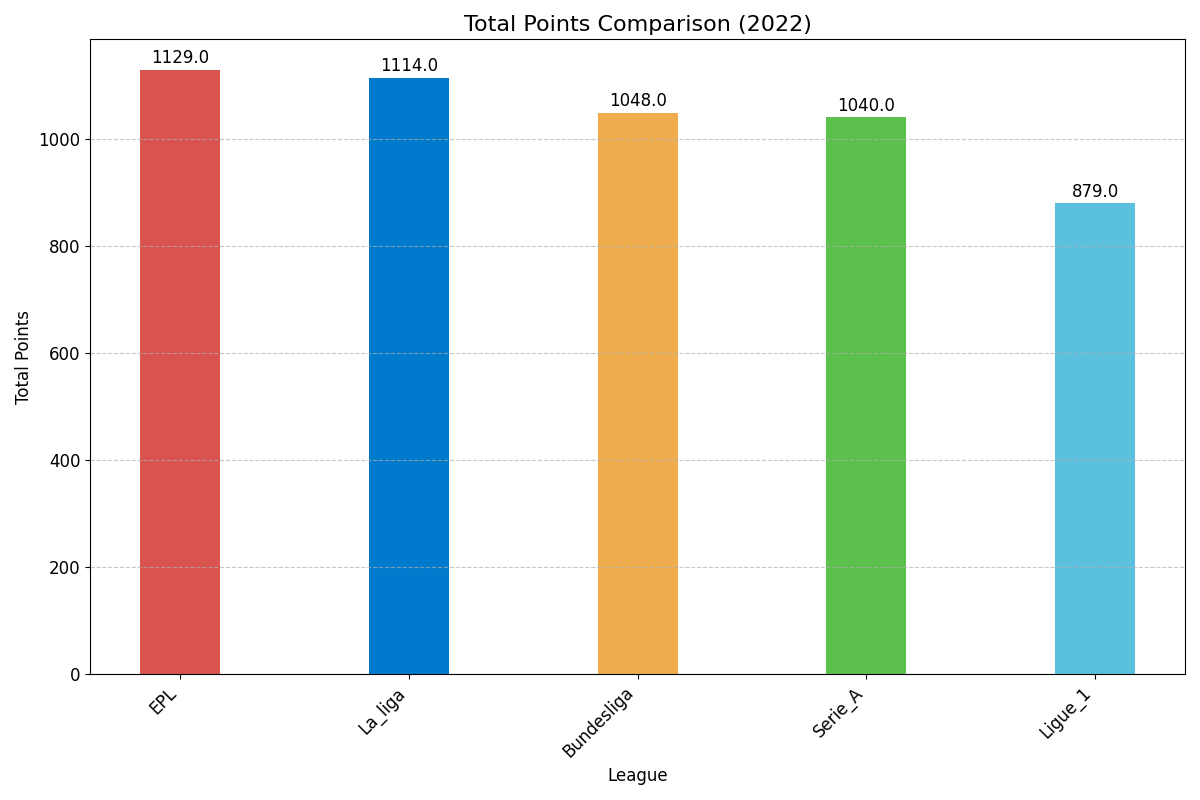
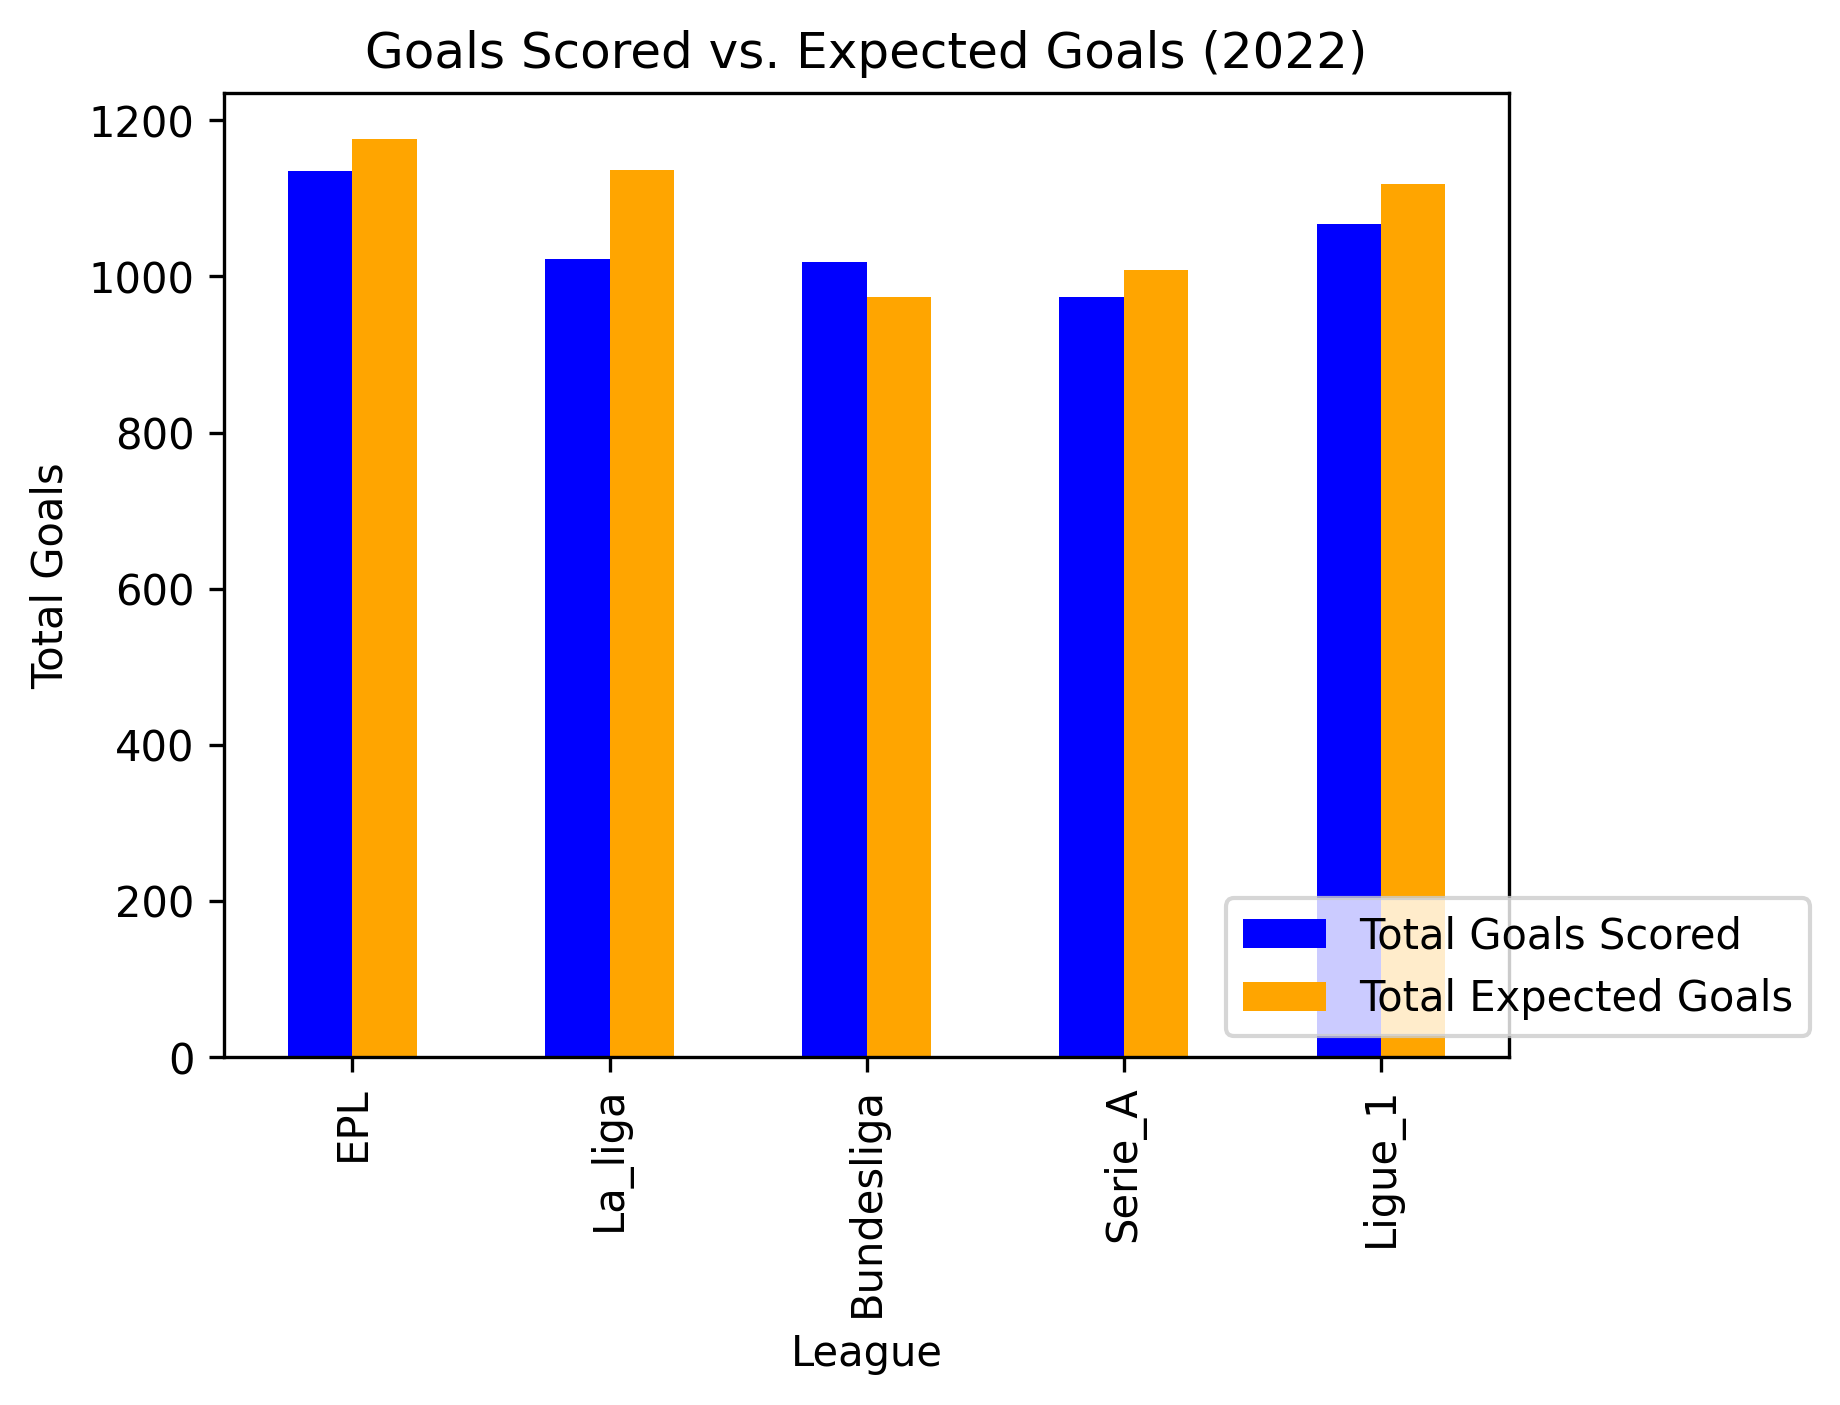
The visual at the left-hand side demonstrates how tightly close the total point accumulation of the leagues are, especially between EPL and La Liga. On the left-hand side we have highlighted each league’s performance on total amount of goal scoring and expected goal scoring. Through observation, it is important to highlight how close Bundesliga and Serie A are on these metrics for the 2022-2023 season.
Lastly Ligue 1, producing the lowest amount of total points out of the five, and also being ranked third on “Total Expected Goals” demonstrates how competitive the French league is for the clubs participating.

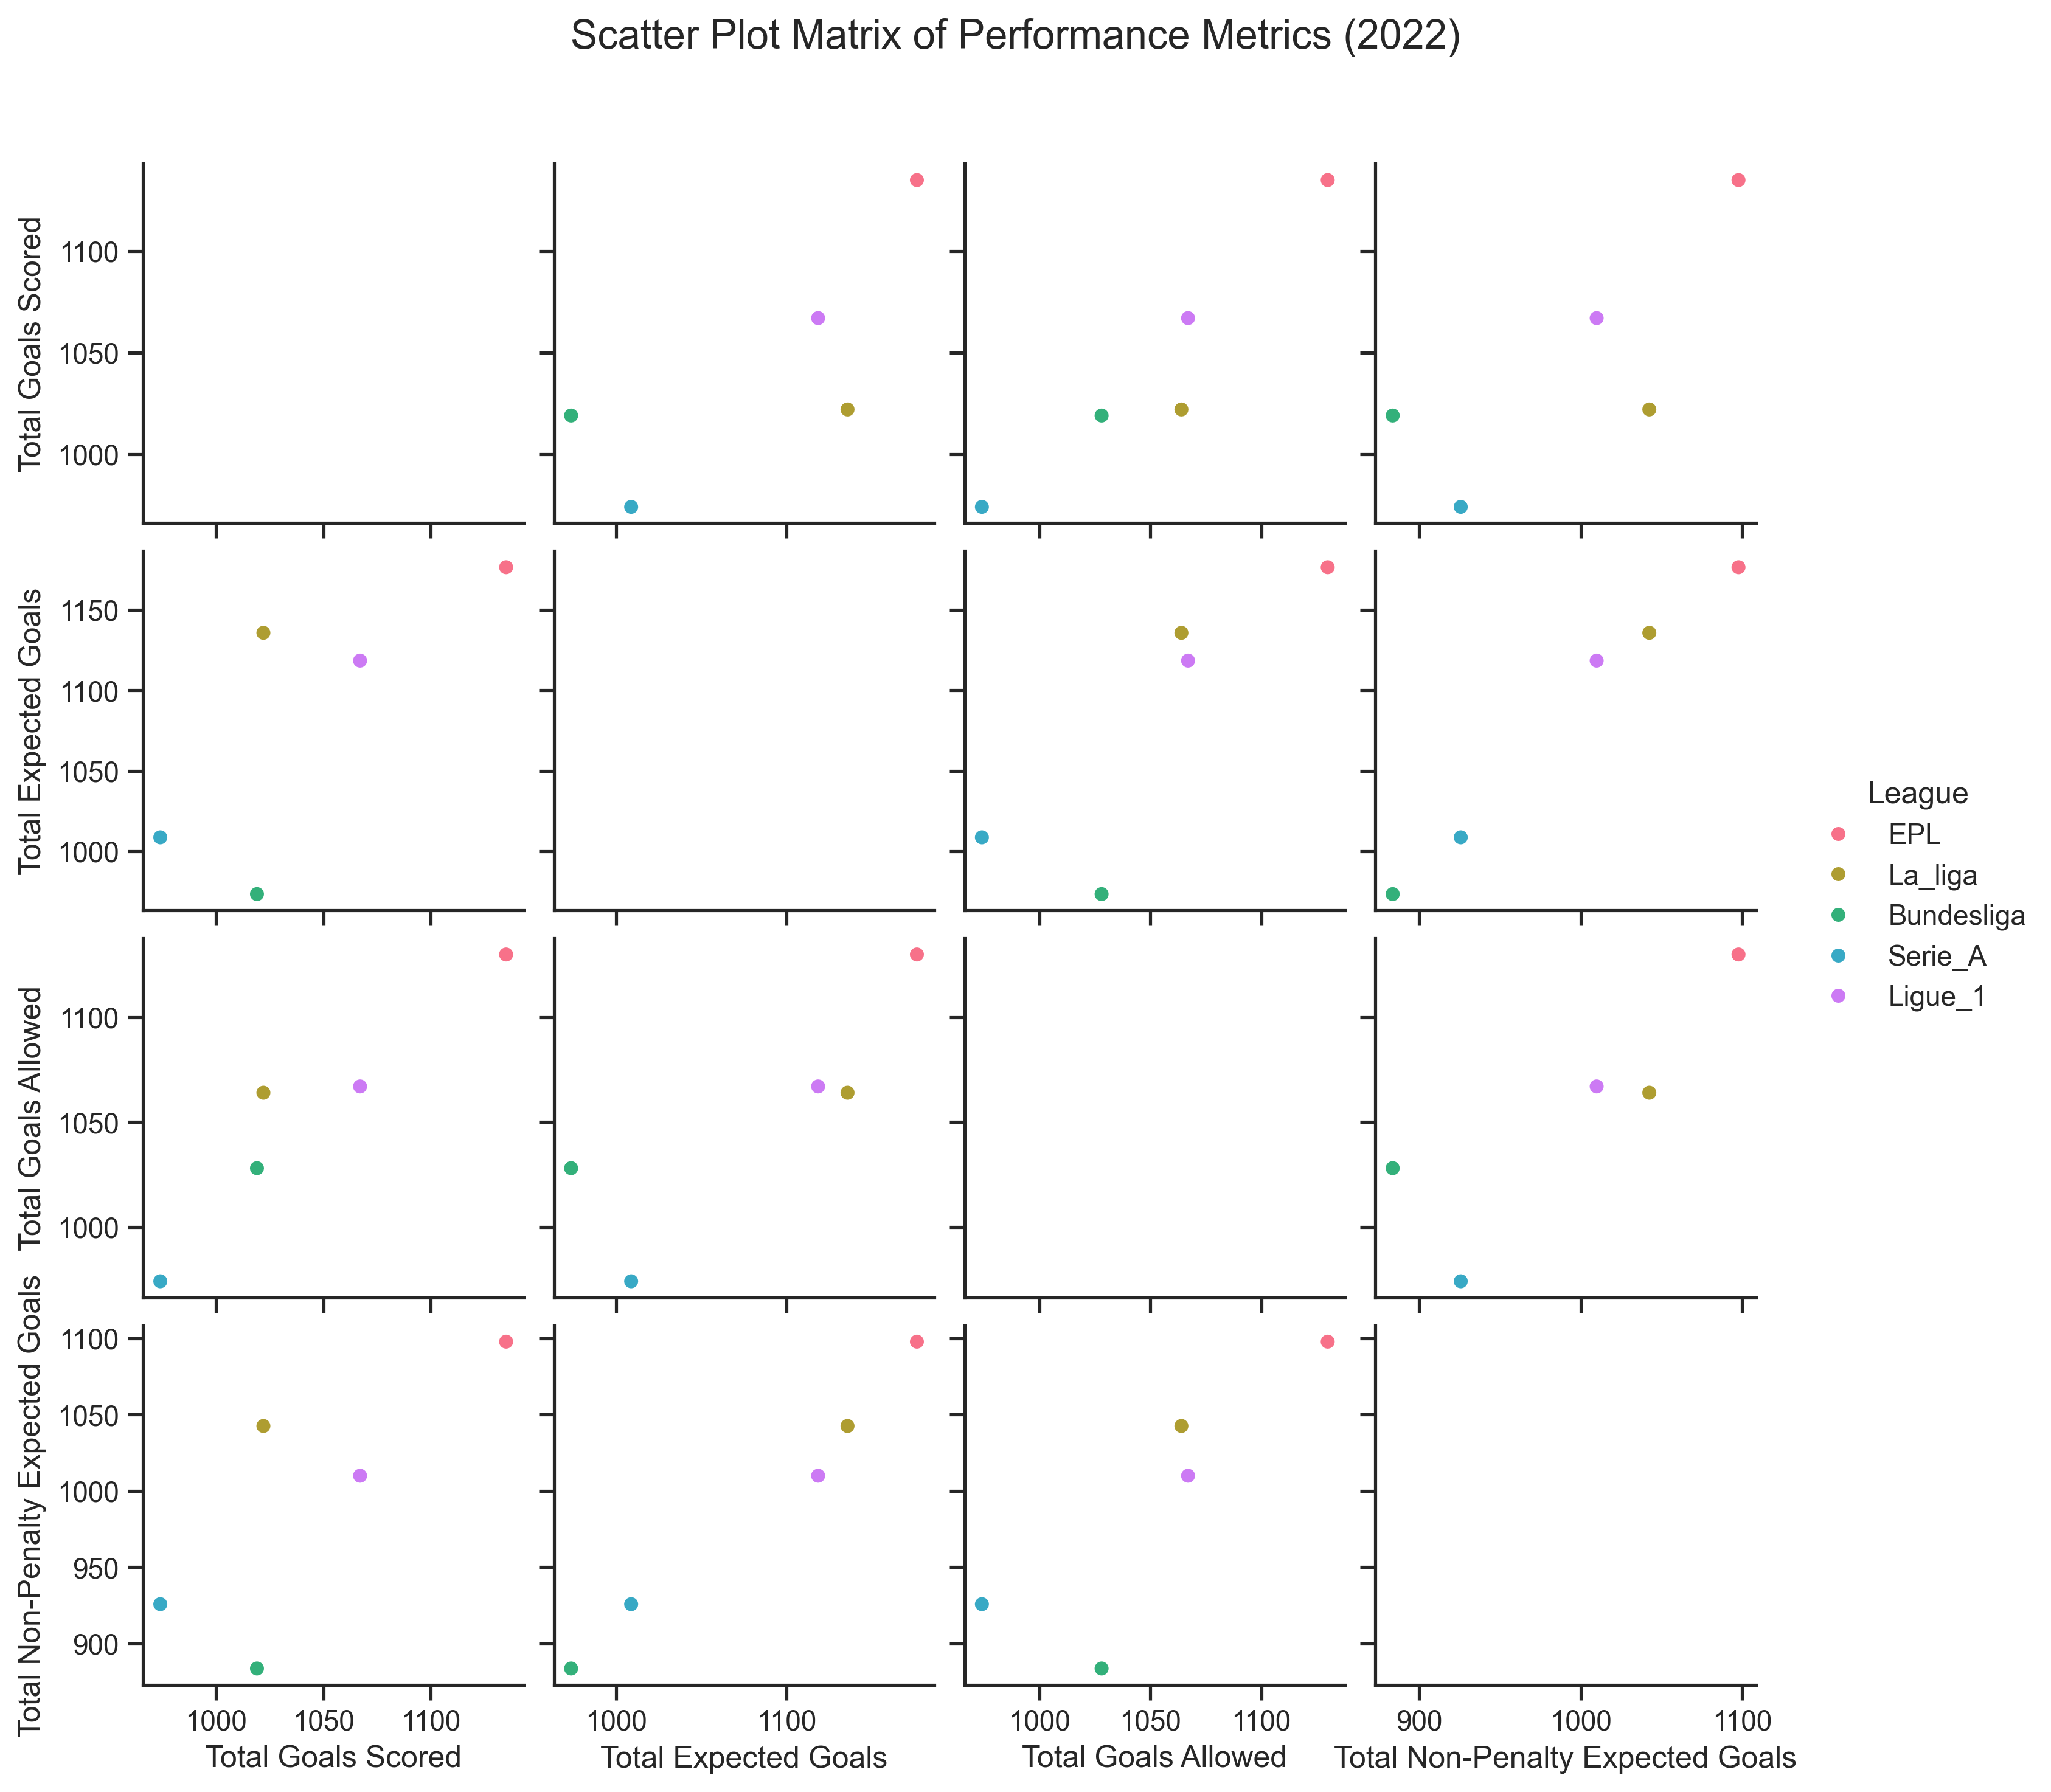
Through this scatter plot, we can examine the top 5 league’s performances on Total Non-Penalty Expected Goals, Total Goals Allowed, Total Expected Goals, and Total Goals Scored. It is evident to see the over-dominance of the English Premier League when we are analysing goal contribution aspect of the game. Bundesliga is performing below the average when we are examining “finishing”; one of the crucial parts of football.